Trading Education
Candle Patterns for Traders
Study candle behavior, then connect it with Chart Assistant detection, context badges and Strategy Lab rules. Patterns are not signals by themselves, but they can support better review when trend, levels, invalidation and risk are considered together.
Read market behavior
Candles show how buyers and sellers interacted during a period, including rejection, momentum, indecision and pressure.
Connect patterns with Chart Assistant
Chart Assistant can detect supported candle patterns and display them as badges so traders can inspect what appeared in the current market context.
Use context first
A candle pattern becomes more useful when read near support, resistance, swings, BOS or CHoCH levels, and an invalidation idea.
Why candle patterns matter
Candle patterns are visual representations of market psychology. Inside Cobra, they work best as educational context for chart review, AI Chart Review and strategy rules, not as automatic trade instructions.
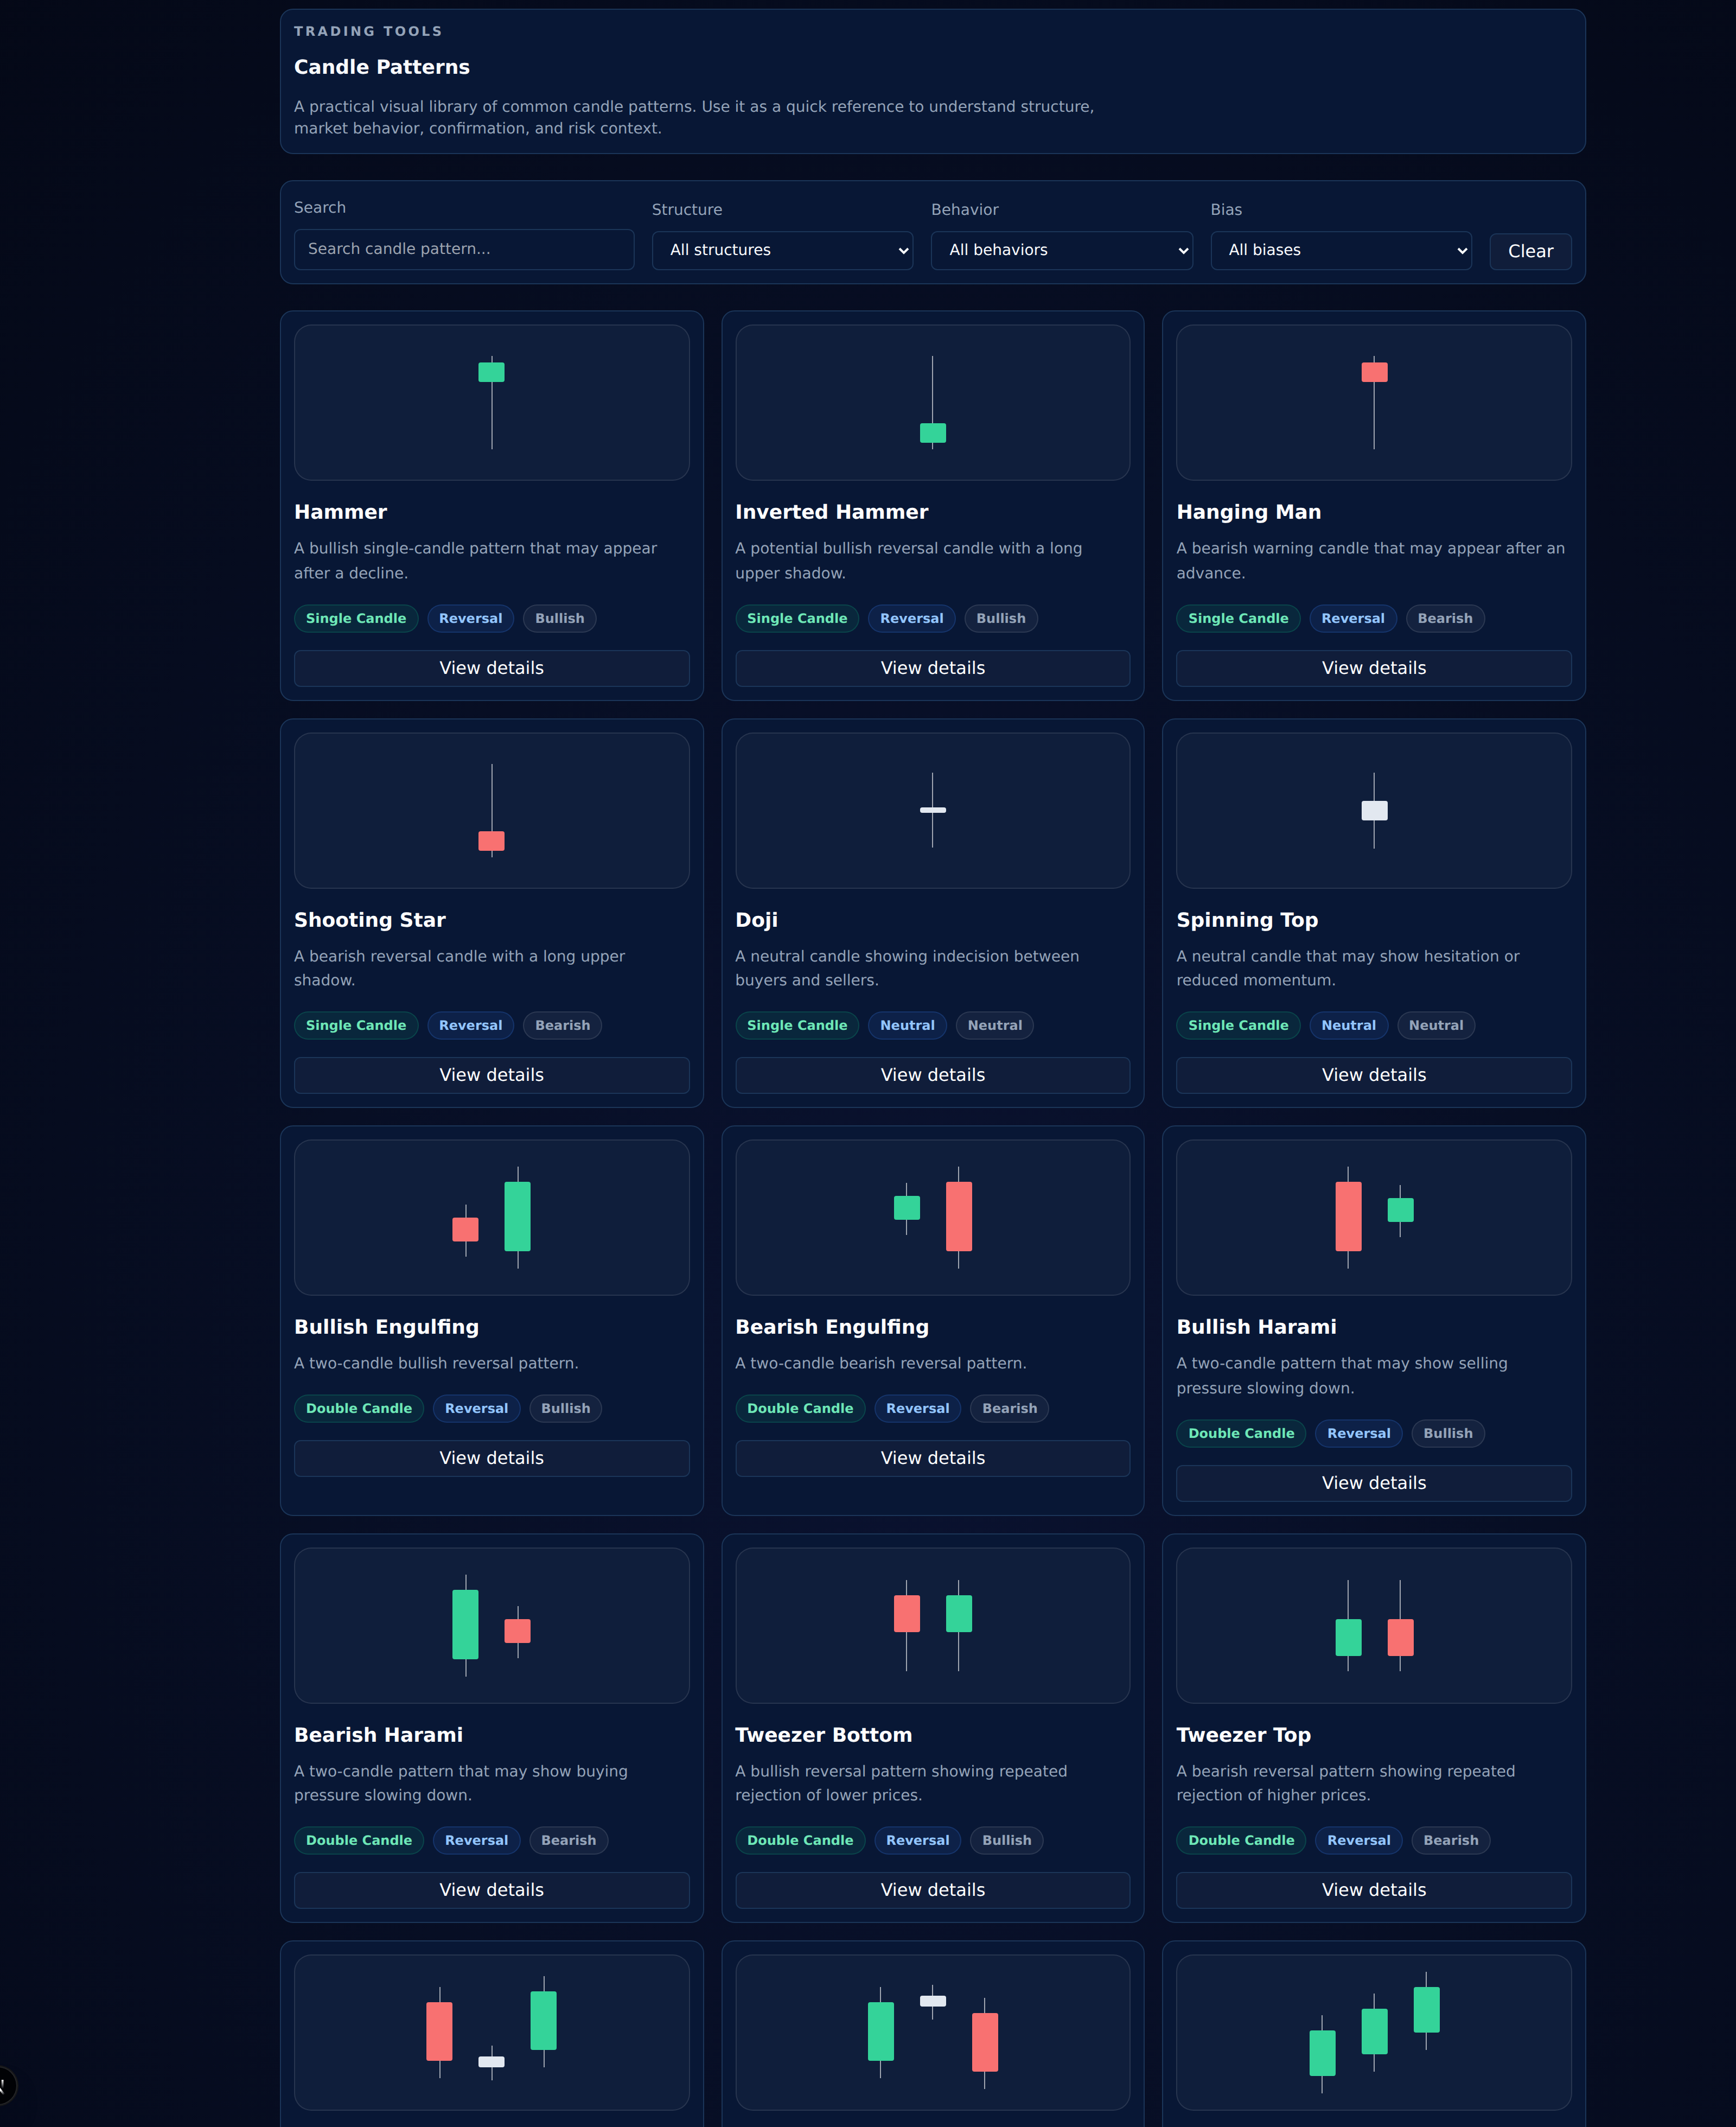
Common candle pattern groups
- • Single candle patterns: hammer, shooting star, doji and spinning top.
- • Double candle patterns: bullish engulfing, bearish engulfing, harami and tweezer formations.
- • Triple candle patterns: morning star, evening star, three white soldiers and three black crows.
- • Reversal and continuation readings based on market context.
Patterns are not guarantees
Candle patterns should never be used as standalone signals. Traders should combine them with trend, support and resistance, confirmation, invalidation, position sizing and disciplined risk management.