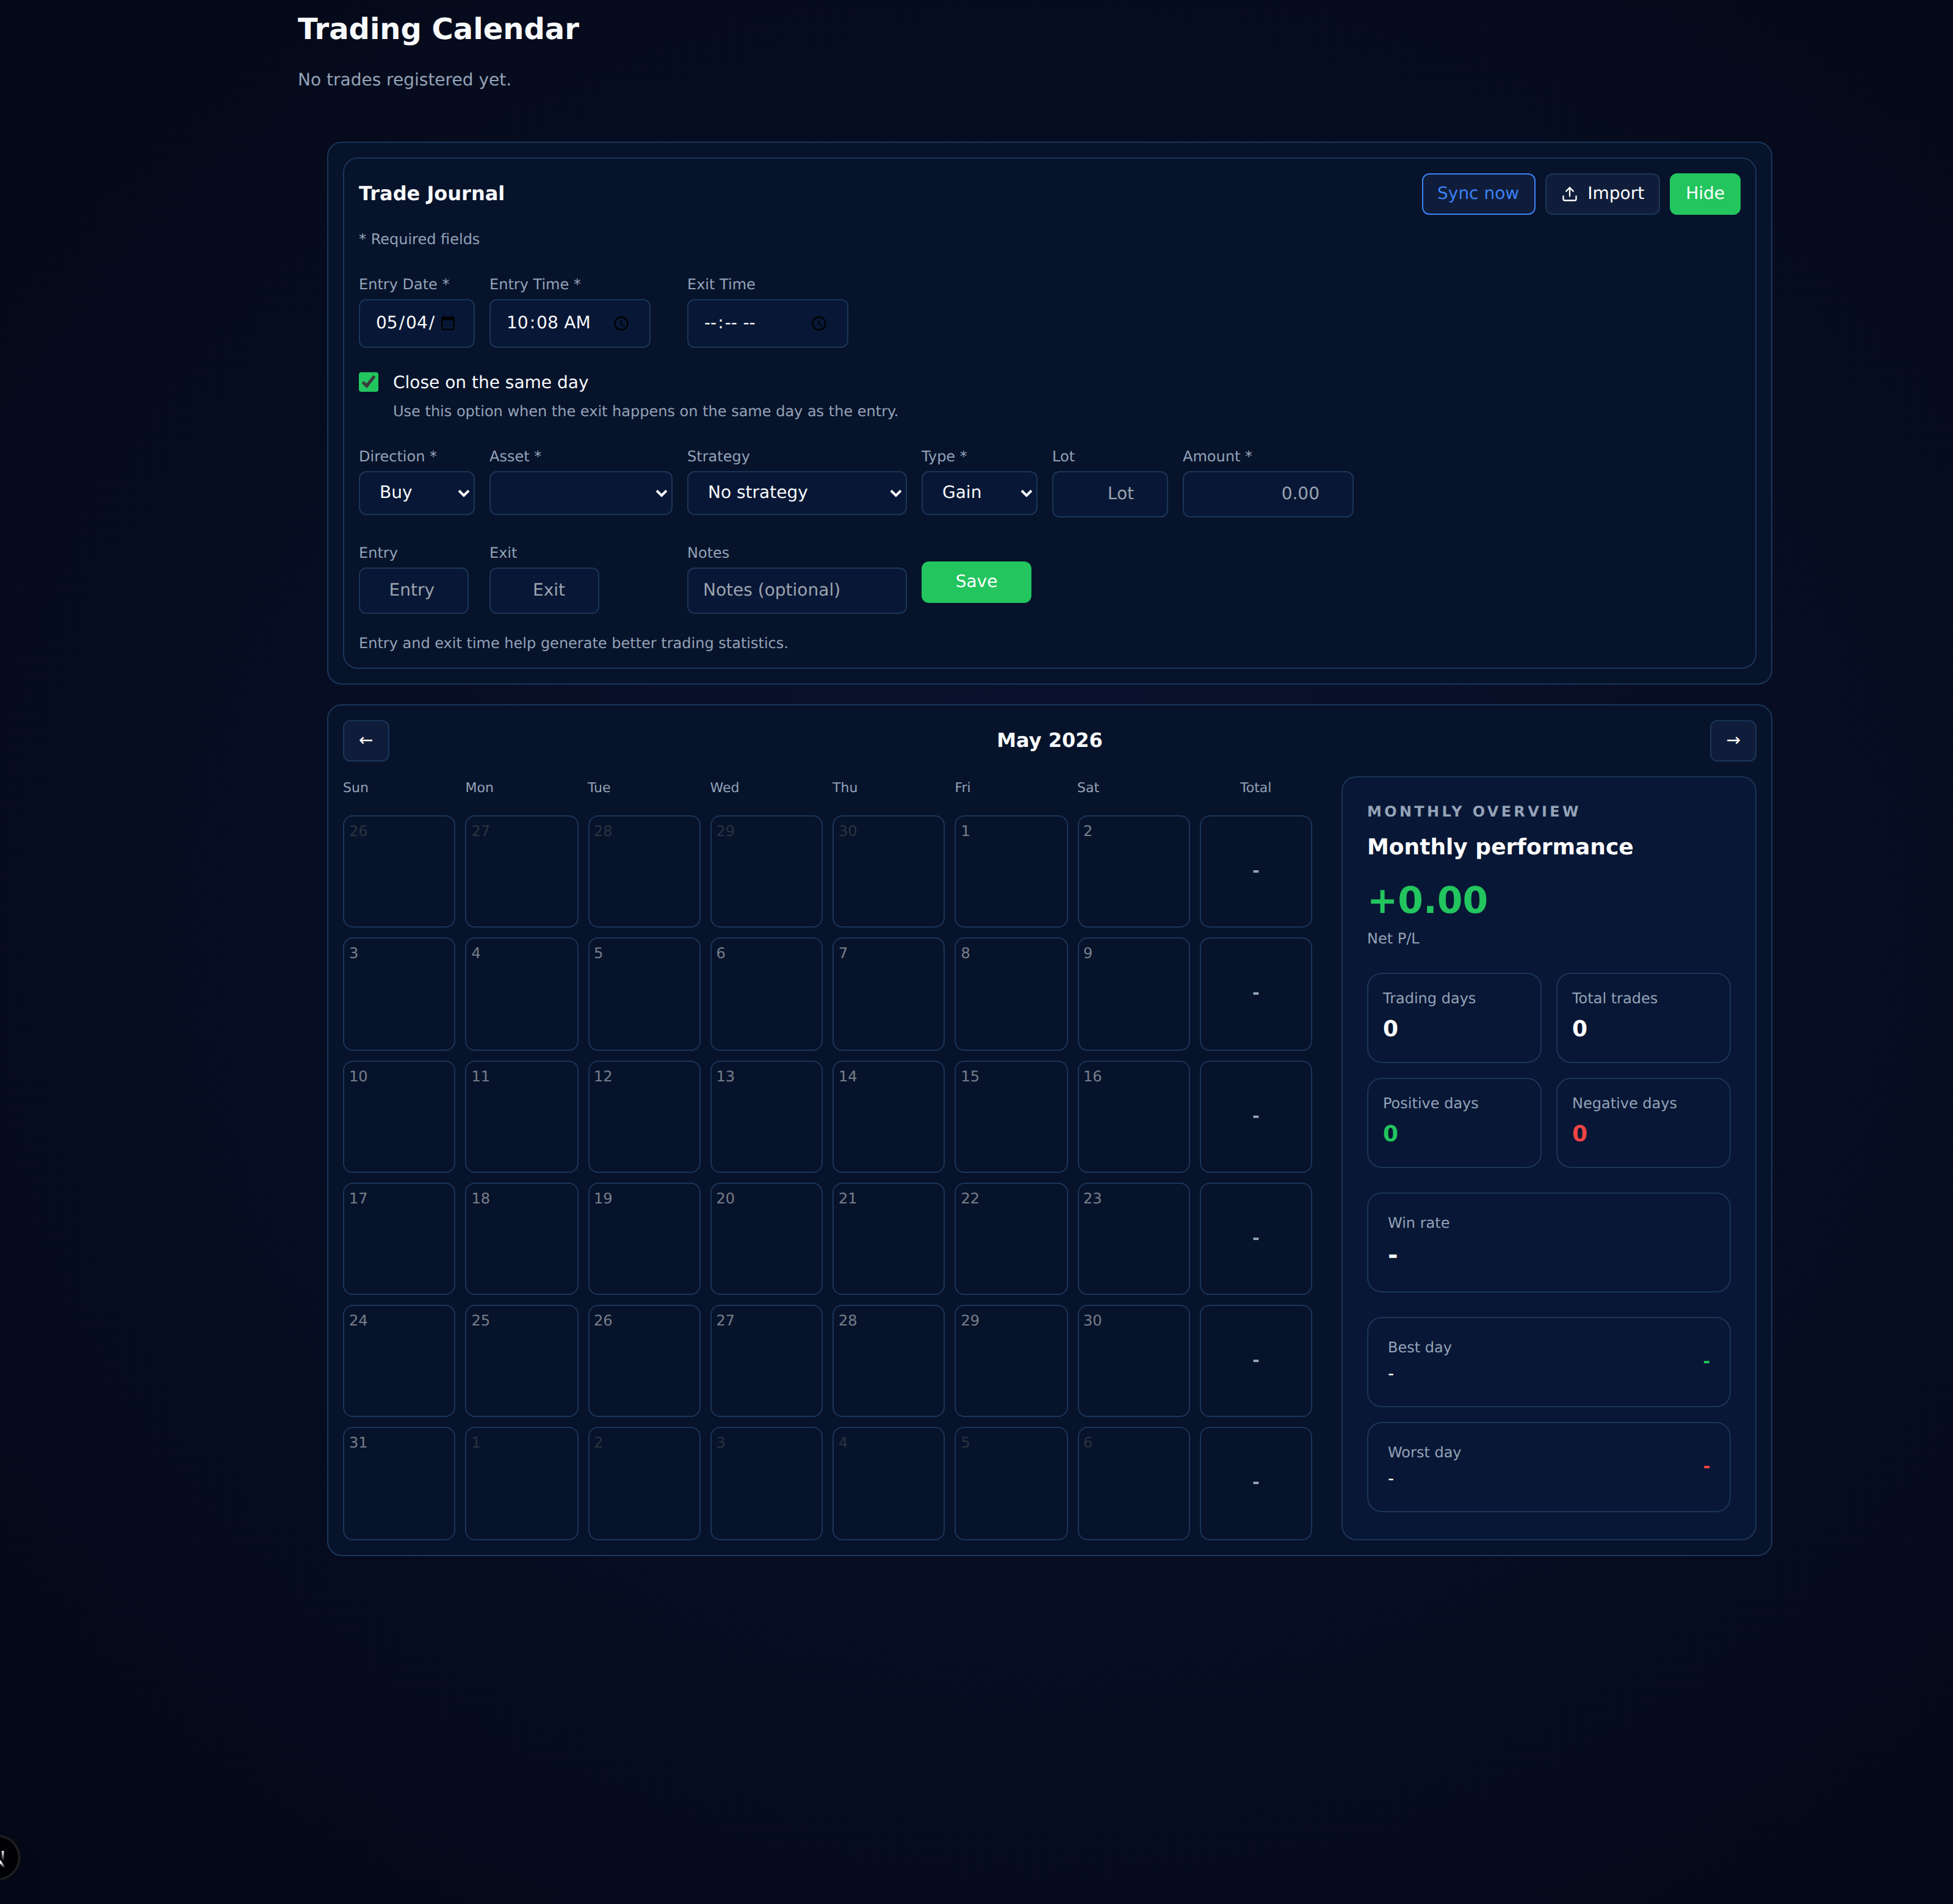
Positive and negative days
See whether performance is being built through consistent sessions or offset by a small number of difficult days.
Turn every trading day into a clear visual record. CTS brings daily P&L, percentages, monthly context and session review together in one calendar.

The calendar turns trading history into a visual timeline so you can see how results are distributed across the month instead of reading isolated trades one by one.


Selecting a day opens the context behind that result. You can move from the monthly view into a focused session review without leaving the Calendar.
A calendar makes recurring behavior easier to recognize. It gives your trading history a time dimension that raw trade lists cannot show as clearly.
See whether performance is being built through consistent sessions or offset by a small number of difficult days.
Spot the sessions that contributed most to the month and the days that created the largest setbacks.
Read monthly win rate together with trading days and total trades to add context to the result.
Move through weeks and months to review progress as a sequence of trading days rather than isolated outcomes.
CTS connects the daily view with the tools used to record execution, control risk and analyze performance in greater depth.
Review the trades and execution details behind the results shown in the Calendar.
Explore Trading JournalCompare daily performance with the risk limits, targets and capital rules configured for the account.
Explore Risk ManagementMove from the calendar view into deeper statistics, equity evolution and performance metrics.
Explore PerformanceUse the Trading Calendar to understand each day in context and keep your review process connected to the rest of Cobra Trading System.