Advanced Statistics

Stop judging performanceonly by P&L

Turn your trading history into a complete view of execution quality. CTS brings performance, consistency, behavior, market, direction and risk metrics into one workspace.

Win rate, profit factor and expectancyConsistency, streaks and durationDrawdown and risk analysis
Cobra Trading System Advanced Statistics with performance, consistency, market, direction and risk metrics
Analysis Snapshot

See the quality behind the result

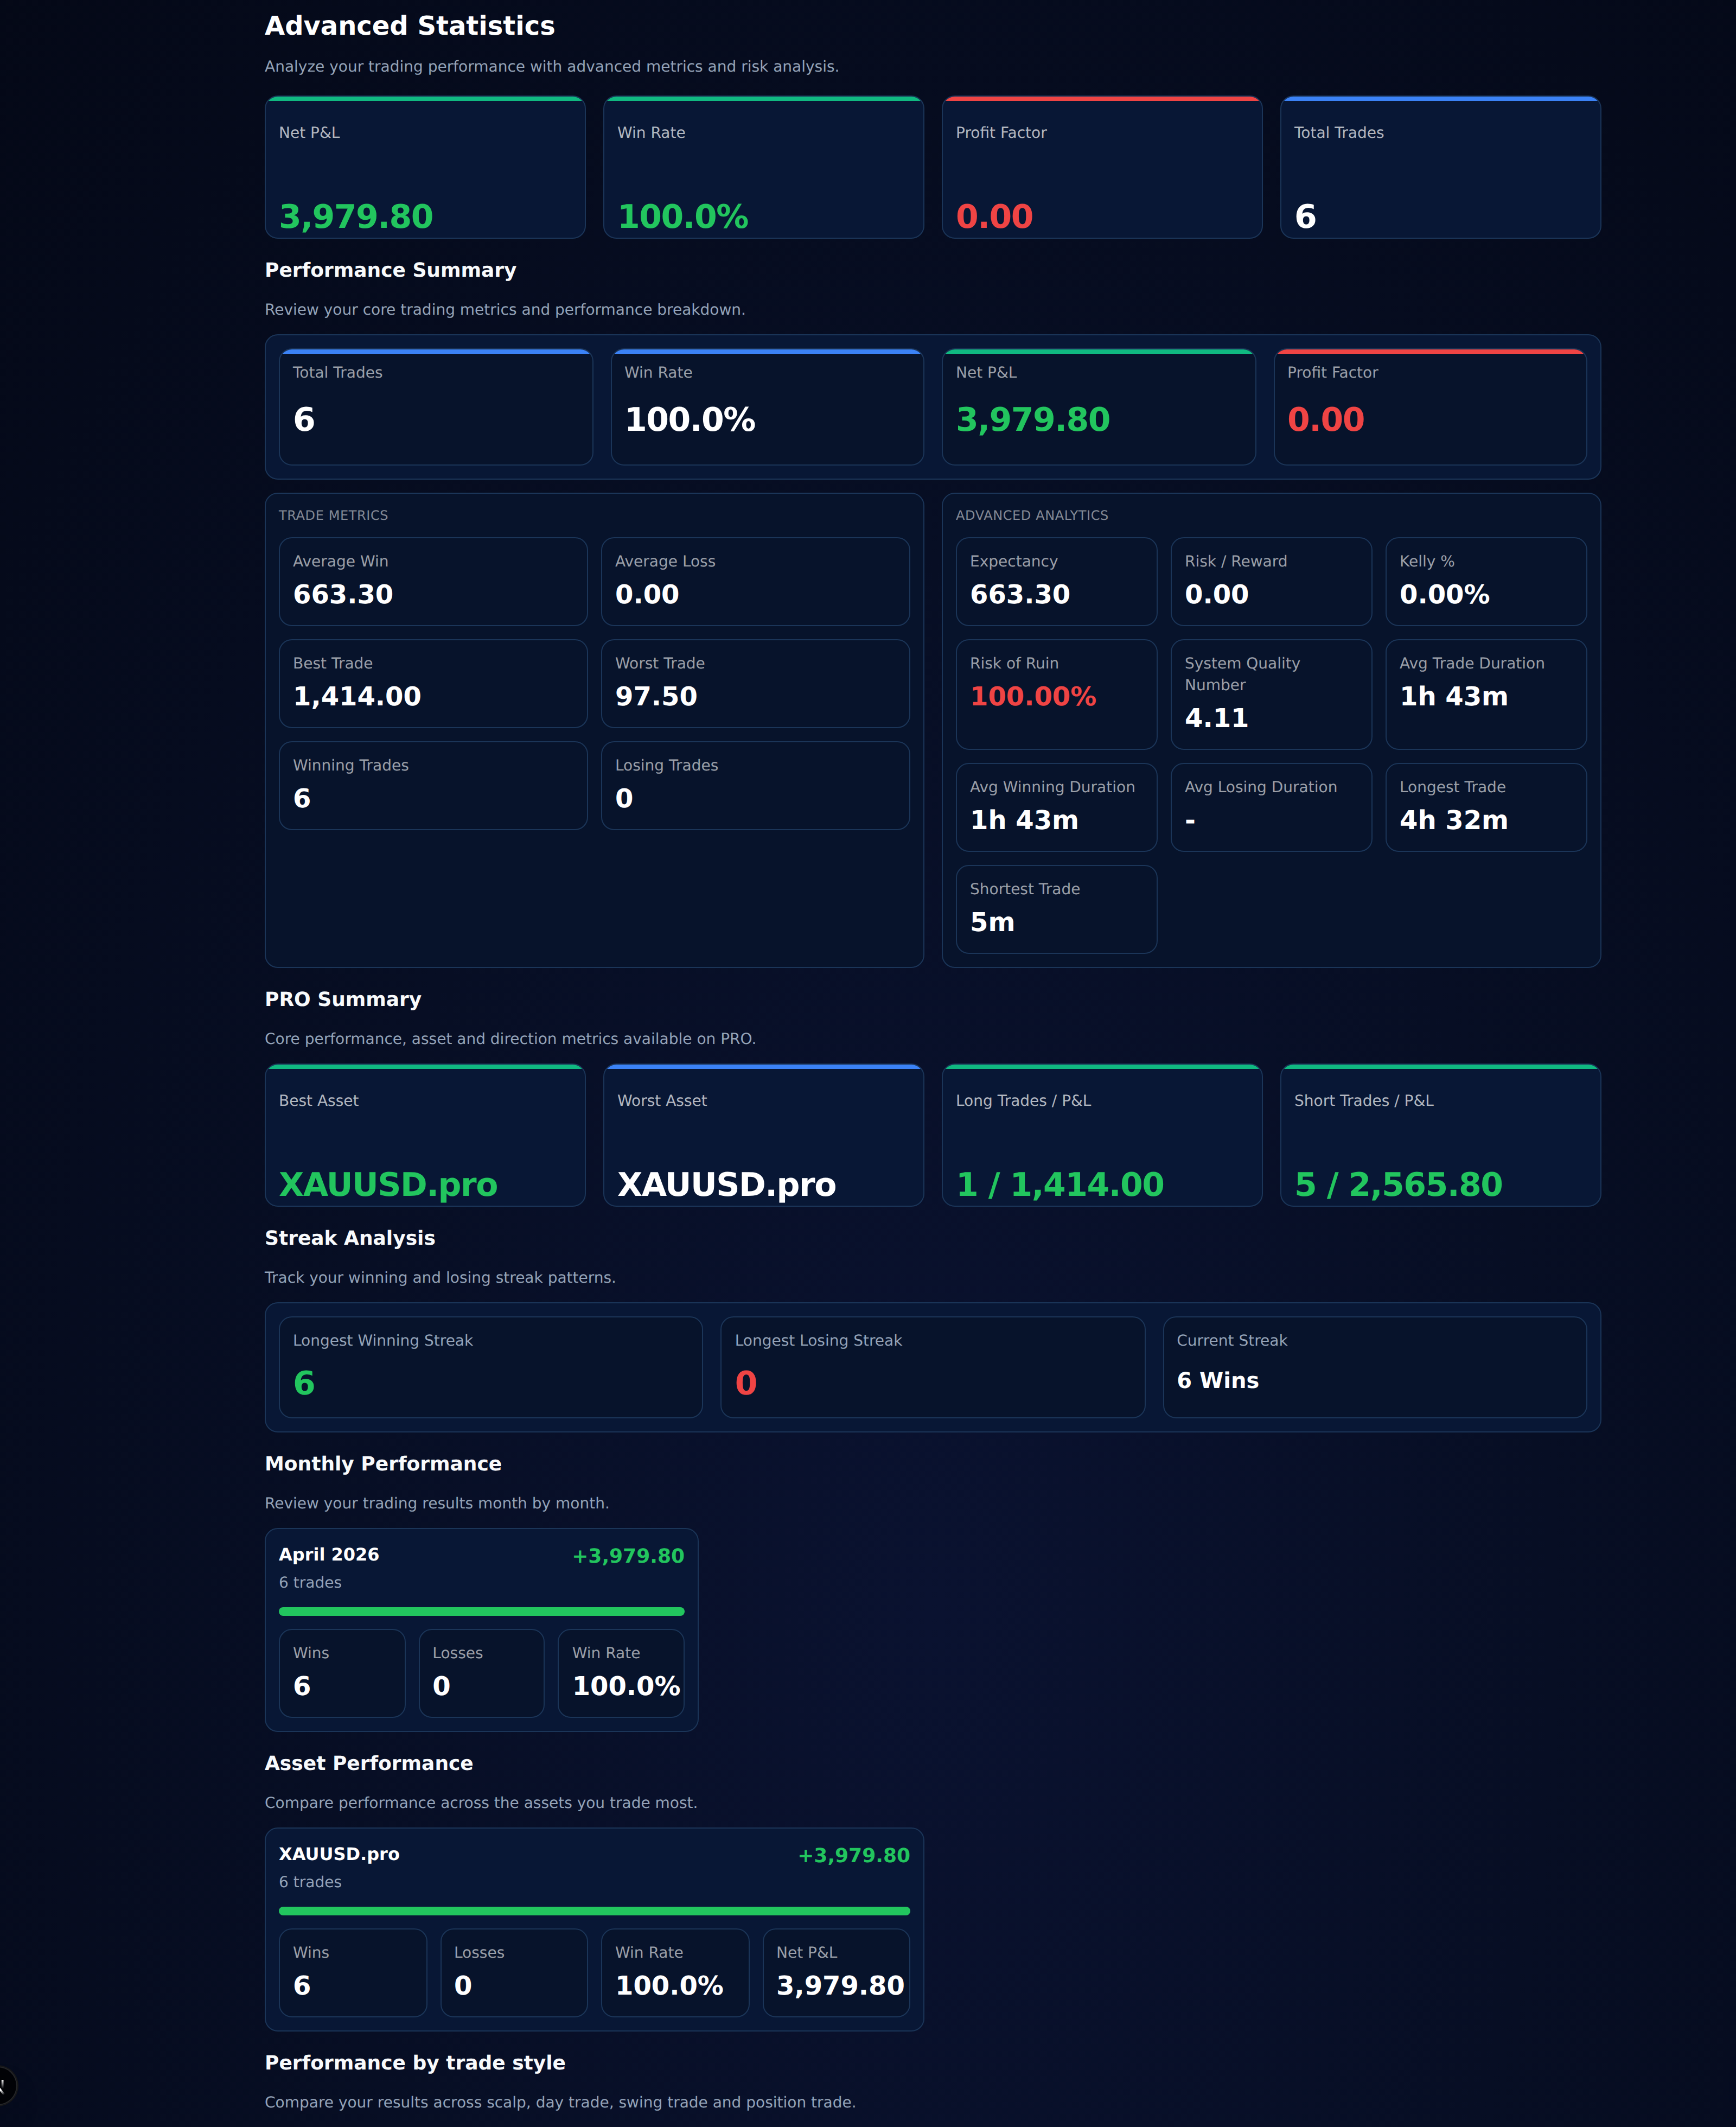
The opening snapshot brings together the essential indicators needed to understand not only how much the account gained or lost, but how that result was built.

  • Compare total trades, win rate, net P&L and profit factor.
  • Review average win, average loss, best trade and worst trade.
  • Use expectancy, risk/reward, Kelly, recovery factor and SQN for deeper statistical context.
  • Apply a specific date range to compare different phases of your performance.
Advanced Statistics snapshot with core performance and statistical quality metrics
Performance in context
Quality and Consistency

Find where your performance actually works

CTS separates raw results from statistical quality and adds context around behavior, market exposure and trade distribution.

Statistical quality

Compare profit factor, expectancy, SQN, recovery factor and other metrics that help evaluate the efficiency of your process.

Streaks and consistency

Review longest winning and losing streaks, the current streak and the distribution of winning, losing and neutral trades.

Time in the market

Understand average duration, duration of winners and losers, and differences across scalp, day trade, swing and position trading.

Market and direction

Compare performance by asset, Long and Short to identify where your execution produces stronger results.

Risk analysis with performance evolution, drawdown and configured account limits
Results + risk
Risk Analysis

Performance without risk is an incomplete picture

The final stage connects results and risk to show how the account evolved and what had to be endured to produce that performance.

  • Track performance evolution across the selected period.
  • Analyze maximum drawdown, best day, worst day and average daily P&L.
  • Compare results with configured initial balance, daily loss limit, maximum loss and daily target.
  • Use the account risk profile as part of the analysis instead of treating it as isolated information.
Data Before Feelings

One profitable week does not prove consistency

Isolated results can hide risk concentration, dependence on a few trades or unstable behavior. Advanced statistics help separate perception from evidence so the process can be reviewed more objectively.

Understand Your Numbers

Turn trading history into evidence for improvement

Use Advanced Statistics to understand quality, consistency, behavior and risk without relying only on the account's final result.