01
Define your strategy
Save market, asset, timeframe, direction and rules in Strategy Lab.
CTS Chart Assistant
Detect chart and candlestick patterns, evaluate confidence and confirmation, understand strengths and limitations, review the structure with ISA, and compare the context with saved Strategy Lab strategies.
CTS does not generate trade signals. It helps traders interpret structure, context, and compatibility with their own trading plans.
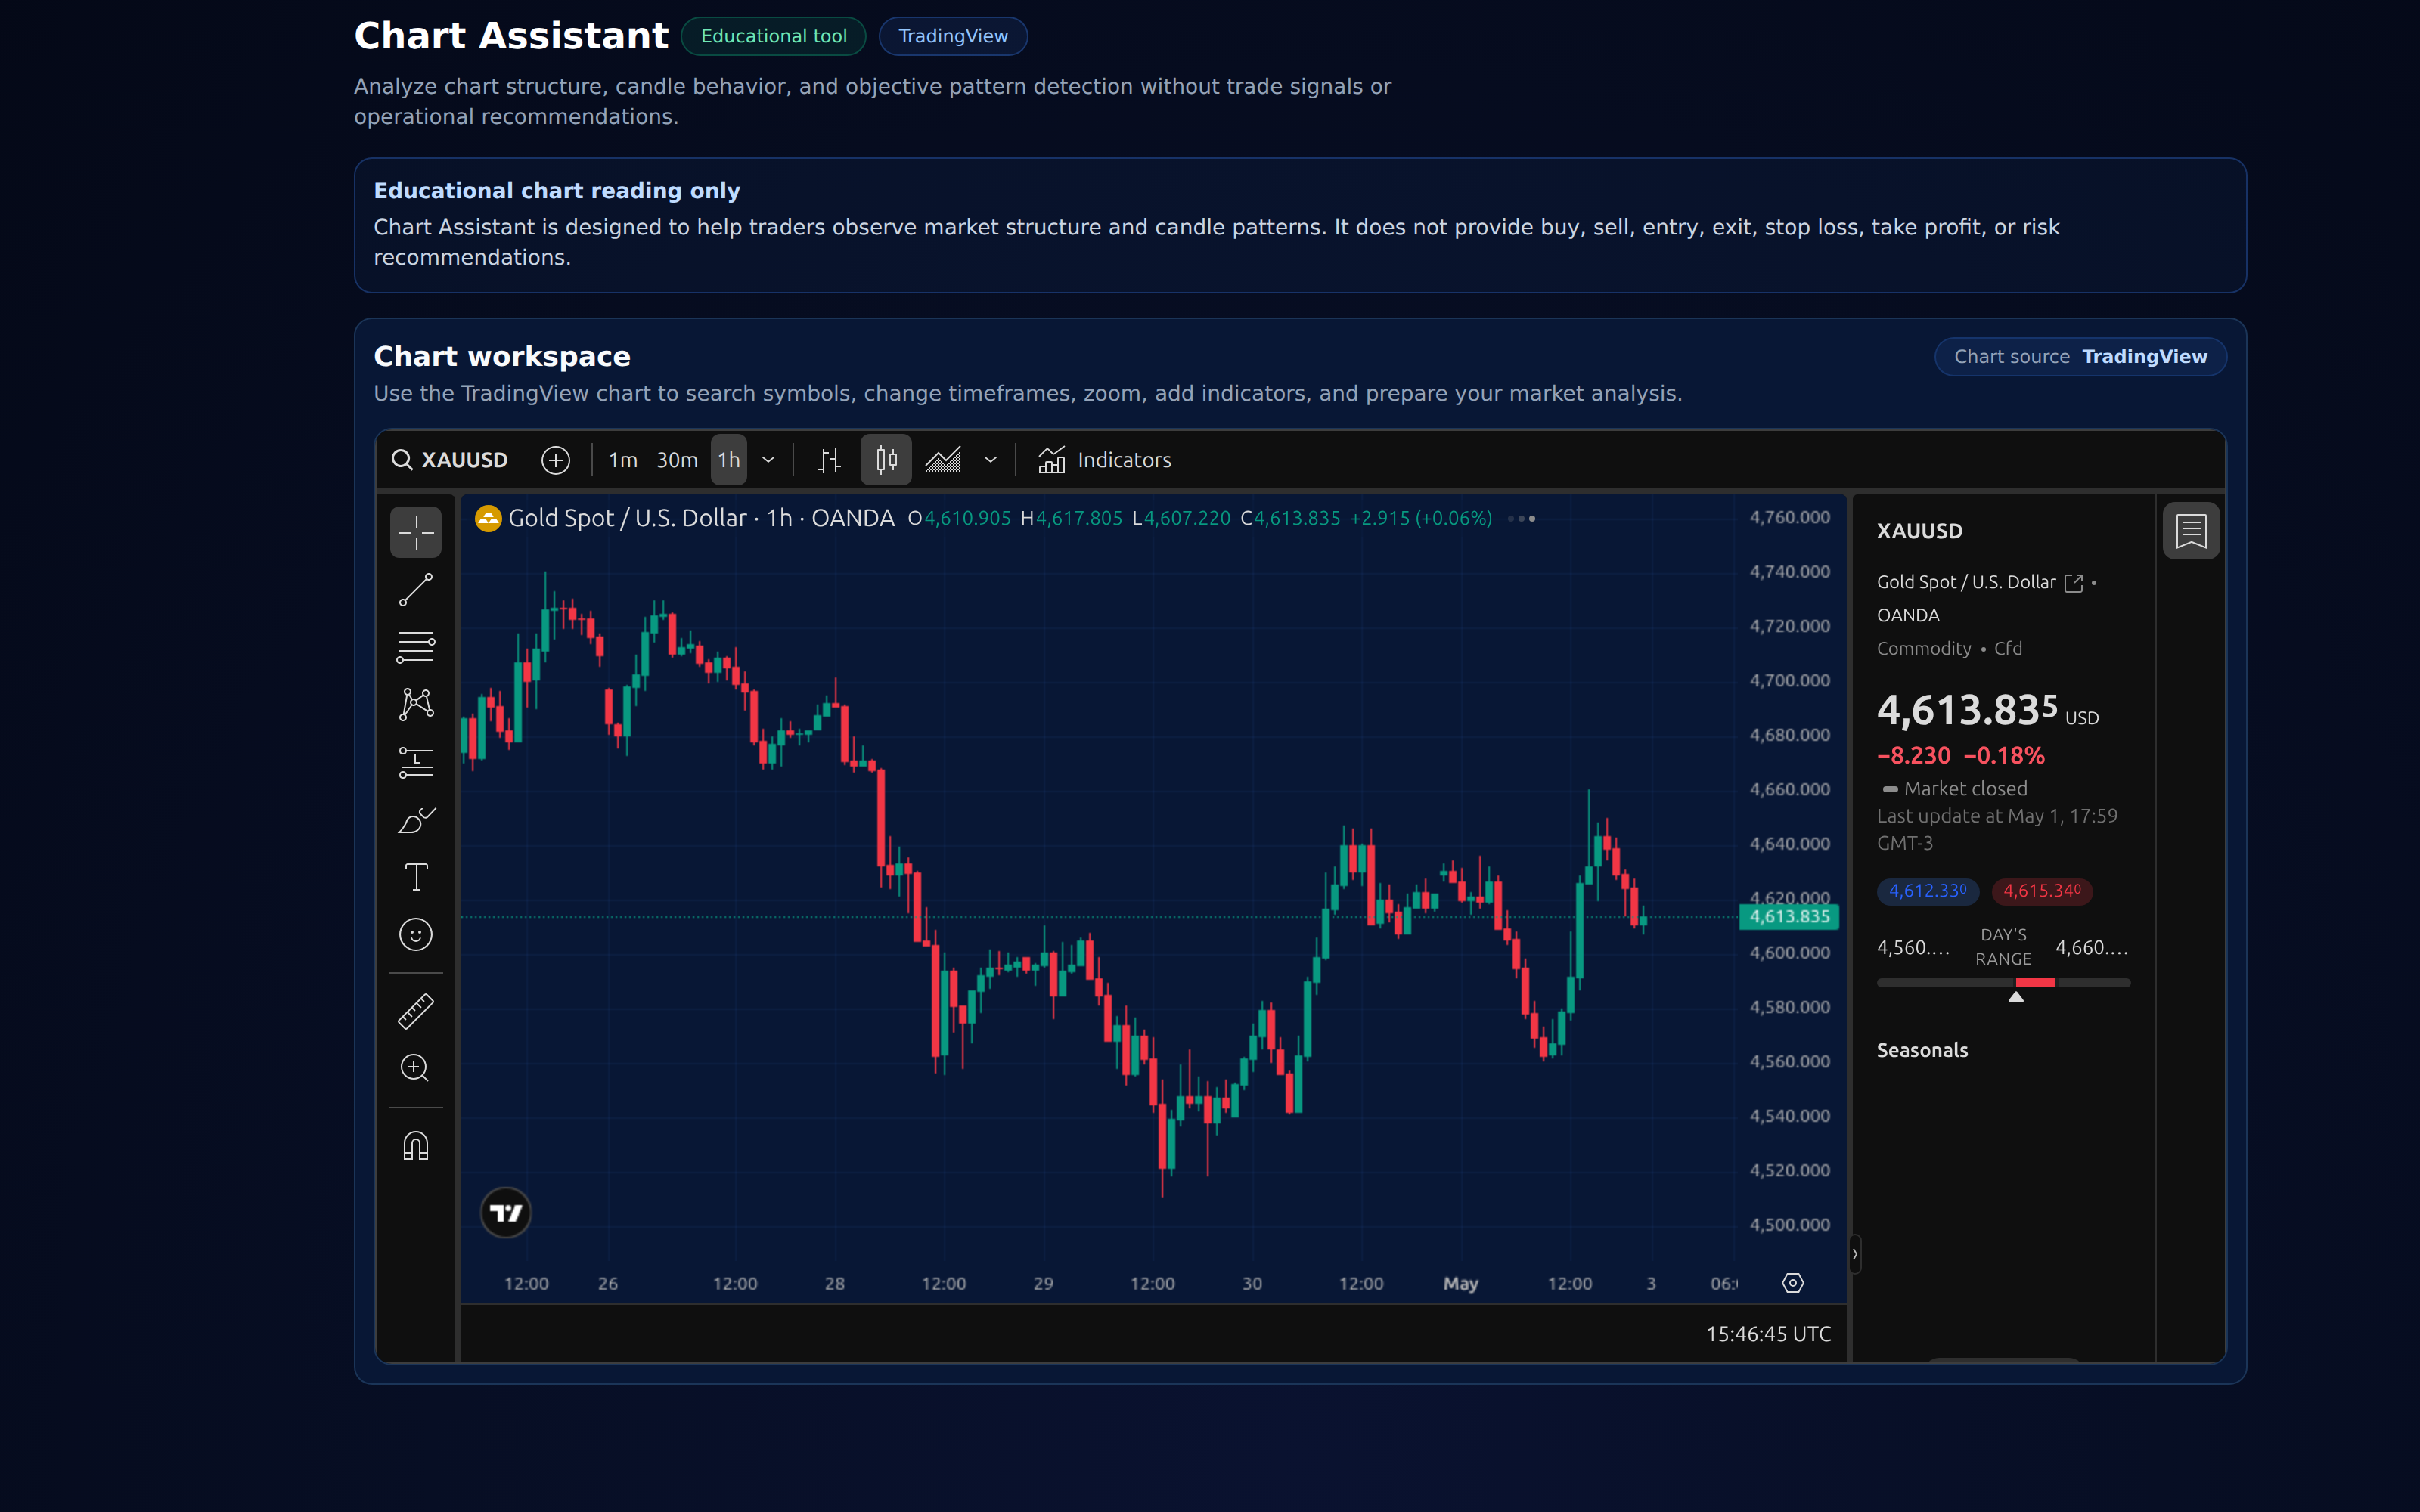
Chart Assistant connects structure, pattern explanation, ISA review and strategy compatibility so the trader can review the market against a defined plan.
01
Save market, asset, timeframe, direction and rules in Strategy Lab.
02
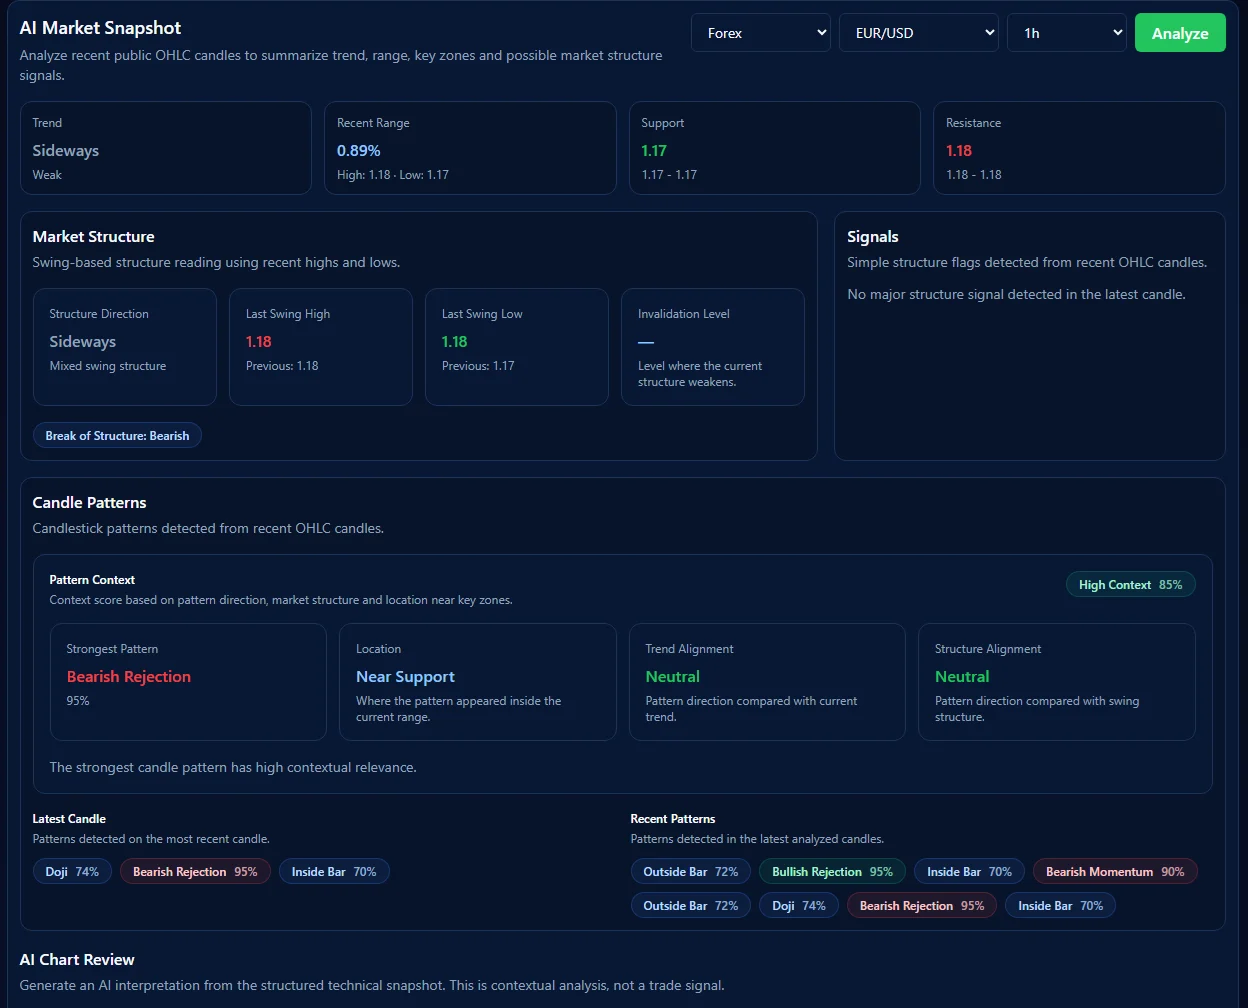
Use the CTS Analysis Chart to review swings, support, resistance, BOS and CHoCH.
03
Inspect detected candlestick and chart patterns with confidence, confirmation and deterministic explanation.
04
Rank saved strategies by structured compatibility with the detected pattern.
05
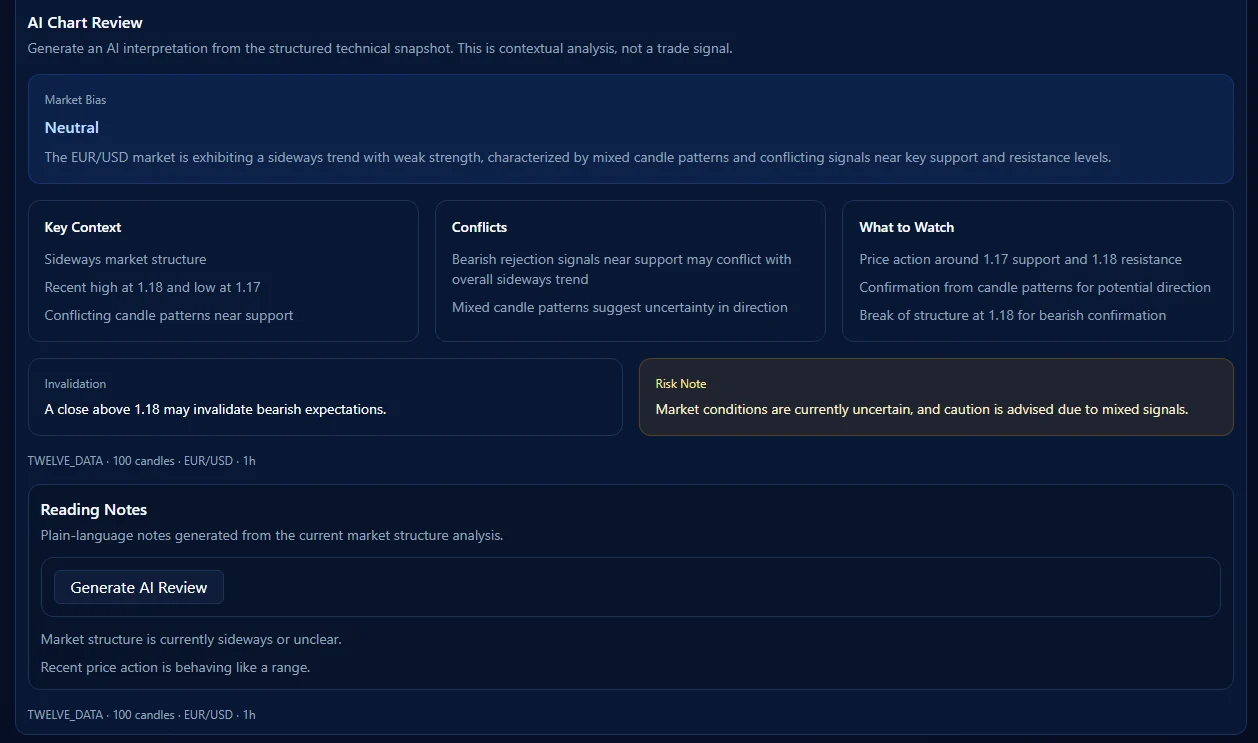
Ask ISA to explain confidence factors, confirmation, limitations and structural invalidation.
06
Use the Journal to review execution against the chart context and your strategy.
CTS Analysis Chart
The CTS Analysis Chart renders the same OHLC data used by the technical snapshot, with visual context for market structure and detected patterns.
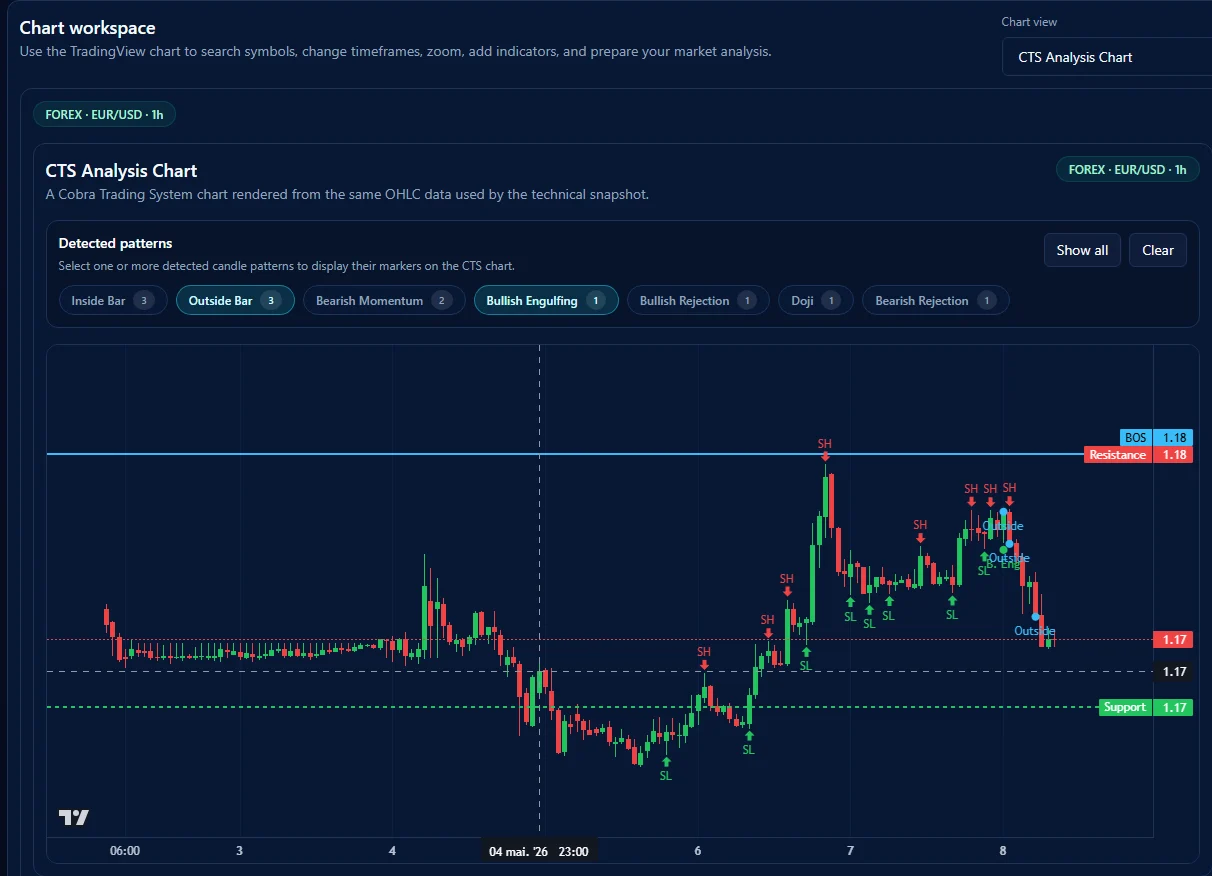
Pattern Detection
Chart Assistant detects documented structures and explains their current state without treating confidence as a probability of profit.
Deterministic Explanation
Each detected chart pattern includes a deterministic explanation with strengths, limitations and structural invalidation context.
Review with ISA
A detected pattern can be sent to ISA with structured context so the review stays grounded in the current chart analysis.
Strategy Lab Compatibility
Chart Assistant automatically compares each detected pattern with active and testing Strategy Lab strategies, then ranks them by structured compatibility.
Define the trader-owned strategy fields that Chart Assistant can compare with current structure.
Document trades and review whether execution matched the chart context and strategy.
Use Cobra Trading System to connect market structure, pattern explanation, strategy compatibility and journal review in one workflow.